Live-Cell
Imaging:
1. Epifluorescent
and Confocal Microscopy
Epifluorescent and confocal microscopy are routinely used
for in our laboratory for biochemical characterization of
cells.
As illustrative examples, below are shown the characterization
of two types of cells in the two research areas of primary
interest to us - Vision and Cancer.
Example 1: Characterization
of Retinal Ganglion Cell Model - Differentiated RGC-5 Cells
In-vitro retinal ganglion cell model is being developed for
establishing quantitative assays of their pathological response
to elevated pressure in glaucoma patients or a retinal prosthetic
device. We have differentiated RGC-5 with staurosporine and
characterized these using immunocytochemistry. The differentiated
RGC-5 cells exhibit neuronal characteristics, including postmitotic
state without apoptosis; neuronal morphology such as soma,
neurites, and growth cones; and other neuronal markers. The
differentiated RGC-5 cells can thus provide a robust platform
for establishing quantitative assays from which refinements
can be evolved to establish assays of acute and chronic impact
of elevated pressure.
Characterization of RGC-5 Cell Line (Undifferentiated and
Differentiated)
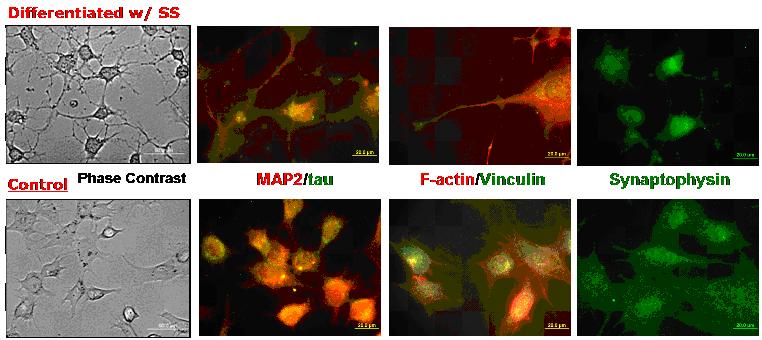
Retinal ganglion cell line RGC-5
was differentiated with non-specific protein kinase staurosporine.
The differentiated RGC-5 showed the neuronal morphology, whereas
the RGC-5 cells untreated with staurosporine were in fibroblast-like
morphologies. Staurosporine promotes the formation of dendritic
neurites in RGC-5 cells. Formation of growth cone-like structure,focal
adhesion of the growth cone, typical fibroblast-like cell
structure of F-actin and focal adhesion distribution were
observed on differentiated RGC-5 via F-actin/Viniculin labeling.
The differentiated RGC-5 cells showed the expression synaptophysin,
a presynaptic vesicle protein was expressed in differentiated
RGC-5 cells, suggesting the presence of synaptic vesicle availability
to form synaptic connection between ganglion cells.
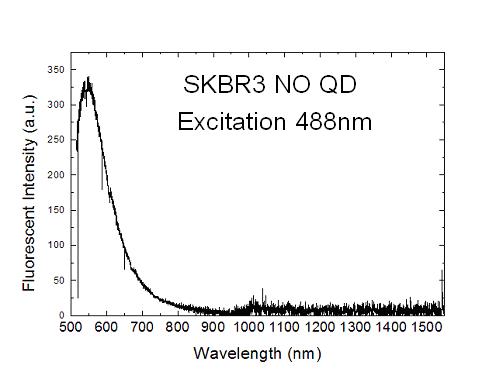
Example 2: Autofluorescent
Spectrum of Cancerous Cells.
In any disease detection scheme which utilizes fluorescent
labeling (E.g. Dye molecules, Quantum Dots) of specific biomarkers,
the autofluorescence from cells limits the ultimate detection
sensitivity (the minimum detectable concentration of labeled
biomarkers). For illustration purpose, an autofluorescent
spectrum from breast cancer cell SKBR3 is shown in the figure
below. The excitation is with 488nm Ar+ laser. Fluorescence
spectra in the 500-1000nm and 1000-1500nm regime are obtained,
respectively, with CCD and InGaAs PD array detectors and are
glued together. Obviously, the autofluorescence in the near
infrared (900-1500nm) is significantly lower than that in
the visible regime. Hence, for high sensitive detection, near
infrared is a more advantageous wavelength for fluorescent
labels. One of our research interests is indeed to develop
InAs and PbS based near infrared nanocrystal quantum dot fluorescent
probes for live cell imaging.
Back to
Live-Cell Imaging Menu
|