|
|
Imaging of cancer cells
Applications of quantum dots as biological probes in
conjunction with nano-scale detection can be extended
towards other novel and medically significant uses
such as the early detection of cancer which is currently
another area of our focus. We are working in
collaboration with Prof. Richard Cote, Dr. Ram Dattar
and Dr. Deborah Hawes's laboratory in the department
of Pathology at the USC Health Sciences Campus to work
towards establishing new paradigms that would enable
early detection of cancer through the use of
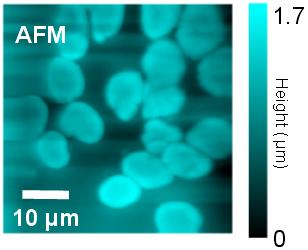
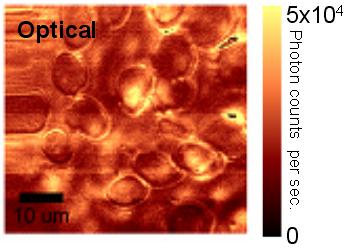
Nanotechnology. Our approach is to obtain simultaneous
topographical and optical information from cancerous
versus normal cells using the near-field optical
microscope to be able to distinguish any structural
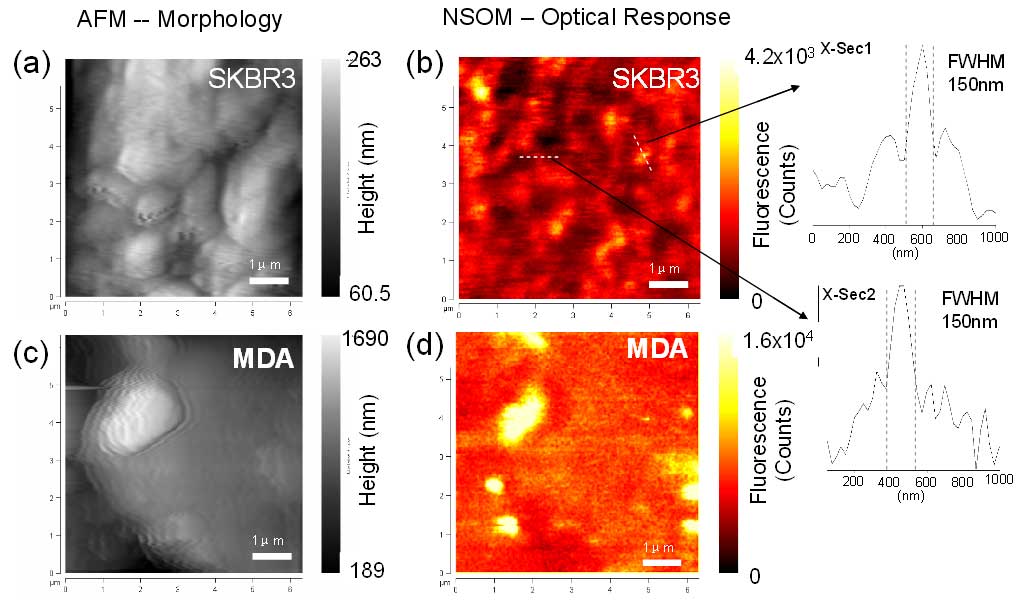
and/or optical differences at the nano-scale. The figure
below shows simultaneously obtained topographic and
fluorescence optical images of breast cancer cells
SK-BR-3 and MDA-MB-231. The cells are labeled with
CdSe/ZnS (600nm emission) quantum dot targeting Her2/neu
receptors on the cell surface. Images are obtained using
a tip of 100nm diameter aperture. The resolution of the
NSOM images, as indicated by the smallest features on
it, is ~150nm. Note that the fluorescence NSOM image of
both SKBR3 and MDA cell is marked by bright areas of
~500nm diameter. This indicates Her2/neu receptors on the
SKBR3 cell surface are not distributed evenly but instead
localized in clusters. . The only difference is that the
number of such clusters on MDA is much smaller than on
SKBR3 cell, which is understandable given the total lower
number of Her2/neu receptor on MDA (2x10⁴/cell) than on
SKBR3 (1x10⁶/cell).
|